Blog #2 - Updates and Stats
2023-02-28 - 2417 Views
And here we are, second Blog entry!
First of all, I want to thank everyone who decided to read the first post (and now this one).
Even if 80% of all views on the last post didn't actually read what I wrote, it still means around 20 people decided to do it, which means a lot to me!
So, what happend this month?
I mostly focussed on battleofthebits.com. Doing daily little competitions in various formats and creative genres really got me back into the groove of making things.
A big new thing on the page were writing competitions and I took them as a motivator for myself to write more regularly again. You can find my little short stories on my profile under "Entries". Note, that my ficitional stories are written and submitted in German, but you can easily use DeepL or similar translation tools online to help yourself out! :D
I also got a music commission this month and am really happy with the result. It's a four minutes long Boss Battle track in the style of old Atari and Commodore Hardware. There will be an upload of it on my YouTube-Channel sometime next month, but for the curious folks, you can already check it out on BotB here.
Since this is all the news I got for this month, I decided to talk a little about my Daily Stats, which I am doing for over 5 years now. The image-embedding isn't the greatest for now, but I hope I will rework that soon.
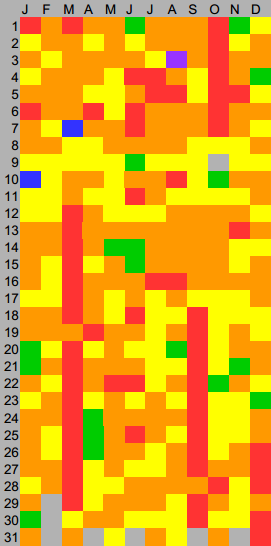
I might've shared some of this on twitter in the past, but as a quick summary: In 2018, i decided to start logging my daily mood in a little spreadsheet by using a color. Red means it was a great day, orange means it was a good day, yellow was an okay day, green was a bad day, blue was a sad day and purple was an annoying day. (There's also a grey day in 2022, which was my flight back from america to europe, where i basically skipped a day.)
I'm now in my 6th iteration of this for 2023 and the best part about having collected data is evaluating it, so this is what I will do now!
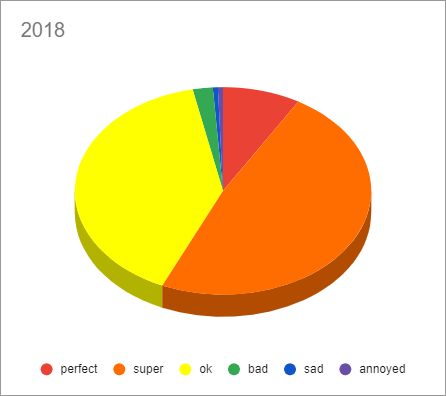
First of all, let's take a look at the datasets themselves.
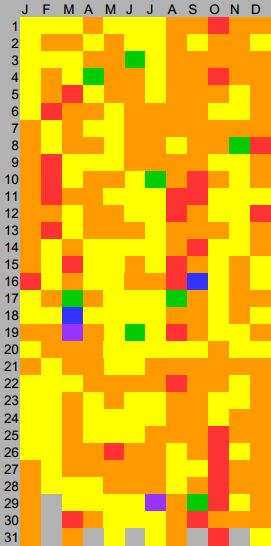
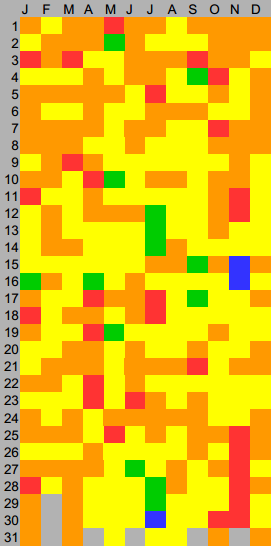
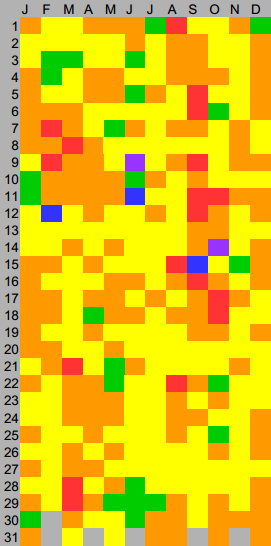
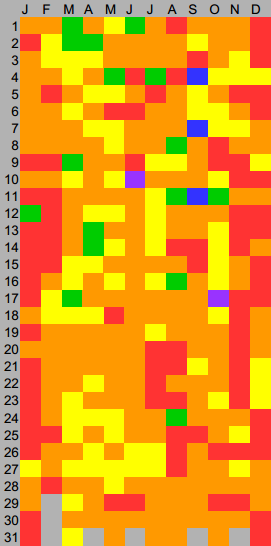
Something that is very outstanding is how great my year 2021 has been compared to the years before it. And even though 2022 was a little less great overall compared to 2021, it was still a very great year! If we take a look at the direct comparison, we can see some more cool stats!
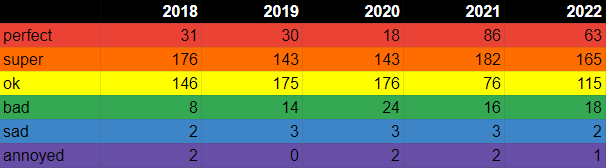
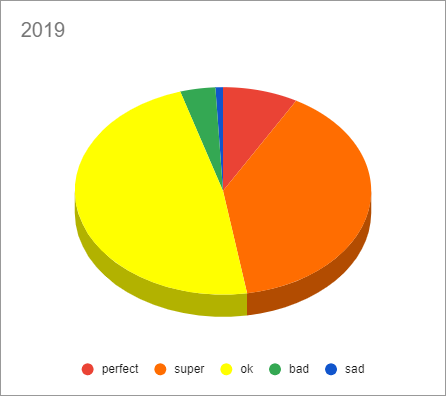
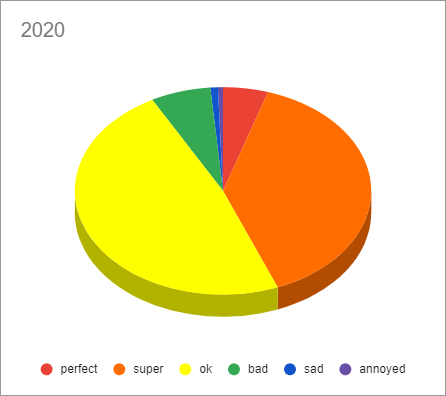
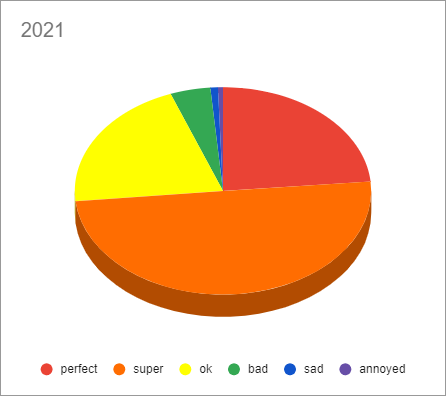
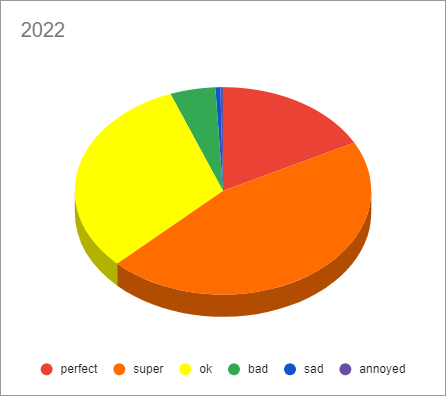
While the total of perfect and good days was below 50% in 2019 and 2020, it really came back in the past two years with 73,5% in 2021 and 62,6% in 2022.
I'm very curious how the upcoming year will be for me!
There is definitely more potential in this for evaluation, like month-wise comparison, but it shall be enough for todays blog-post. I am also logging my year hourly by activity right now, which might give another interesting topic to talk about in the future.
Next time, I might talk about my writing a little more though, so stay tuned for that! See you next month and thanks for reading! :D/